

Indian VCs’ Stellar Performance across the board
VC performance metrics - the USA, Europe, India, and Japan


Macro factors and investor rationale steered the 2020-21 funding boom and the subsequent 2022-23 downturn
Indian VCs stand out from the crowd, with exceptional performance in terms of key performance benchmarks like IRR, TVPI, etc.
While top US and Europe VCs perform satisfactorily, Indian VC medians consistently outshine, highlighting the potential of unprecedented growth
2020 was a year of global distress with the COVID-19 pandemic looming on venture capitalists’ minds as a harbinger of an overdue correction. Yet, the tables turned quite contradictorily. Riding on the tailwind of bullish phases of IPO markets globally, VC Funding saw an unprecedented boom all through 2020 to 2021, with an even stronger uptick in 2021, reaching 211% of funding as compared to 2020 levels. We all saw what happened with Sequoia's investment in Sam Bankman-Fried’s now failed crypto-exchange, FTX.
Yet, the bullish trends were destined to go into a slump. And they did so in 2022, in the form of a screeching halt of a 35% downfall in funding from 2021 levels, which dragged out to 2023, with a 38% decline YoY. The crest and the trough were based on simple market momentum but guided by investors’ rationale. The collapse was a result of inflated valuations, decelerating IPO activity, and a concern of sacrificing satisfactory performance metrics of the likes of IRR, TVPI, DPI, and RVPI*.
So, let us take a look at how VCs in four geographies - the USA, Europe, India, and Japan - have performed through these metrics.
International comparison of Net IRR by vintage year 2022 (median)1

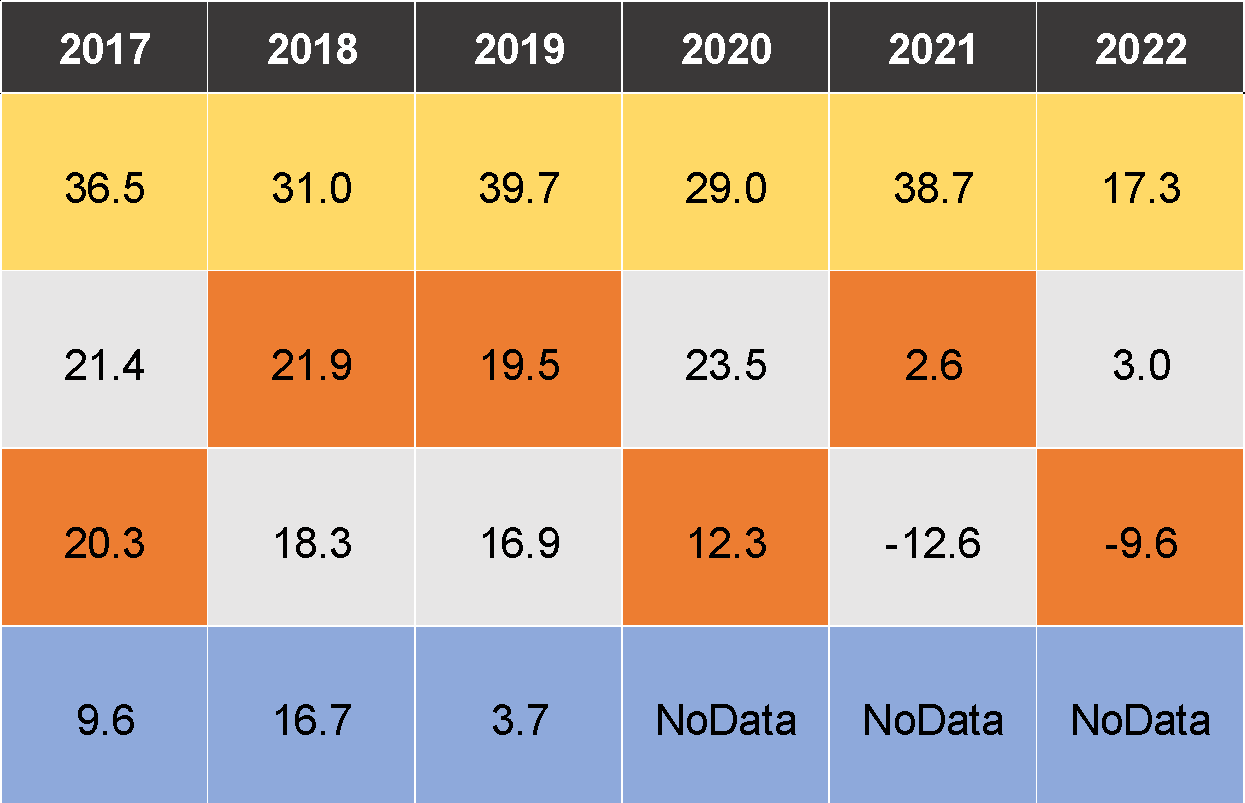
An IRR of ~30% sets India in a league above VC luminary geographies like the USA and Europe. Indian VC and startups ride on the wave of opportunity presented by a rising middle-class population with increased tech-familiarity and a favourable regulatory landscape consisting of national initiatives like Startup India, as well as state-specific initiatives like StartupTN. Meanwhile, Japan lags visibly due to a conventional approach to investing, with a larger focus on risk-averse investments, and an entrepreneurial ecosystem that leaves much to be desired for budding entrepreneurs.
International comparison of TVPI by vintage year 2022 (median)


International comparison of DPI by vintage year 2022 (median)

International comparison of RVPI by vintage year 2022 (median)

The interconnected nature of the TVPI, DPI, and RVPI necessitate an integrated analysis. Indian VC, yet again, continues to retain and provide highest value to its Limited Partners (LPs) with astonishing value creation of ~190% over ~5 years over initial investment with ~30% distributions. This highlights the potential of massive global trends towards increasing investment into the high-flyer geography. Lower exit activity, driven by a longer period of companies staying private, pulls the RVPI up while keeping DPI low for India as compared to the USA. Japan VC doesn’t measure up with quite dismal negative returns for vintage years 2020-22.
International comparison of DPI by vintage year 2022 (Top 25%ile)


International comparison of RVPI by vintage year 2022 (Top 25%ile)

Lastly, let’s take a look at the top performers (top quartile) of VCs in Europe and the USA for DPI and RVPI. The two geographies remain quite competitive around similar figures over the period. Yet, something that stands out here is the median of the Indian VCs. It either remains comparable or outperforms the top quartile of VCs in USA and Europe in terms of RVPI. Our previous analysis of DPI is reflected here with Indian VCs’ DPI lagging behind.
In the volatile VC landscape of 2020-2023, bullish IPO markets initially drove funding surge, followed by a sharp decline. India's standout performance, buoyed by demographic trends and supportive policies, contrasts with Japan's failing ecosystem. Performance trends highlight India's growing influence and potential in the global VC arena.
~Prabhav Agarwal
Footnotes
Sources : (JP) Preqin Performance Benchmark Update for Japanese Venture Capital 2023
(US) PitchBook_Benchmarks_as_of_Q2_2023_North_America.xlsx
(EU) PitchBook_Benchmarks_as_of_Q2_2023_Europe.xlsx
(IN) CRISIL Alternate Investment Funds Benchmarks (2023)
*Net Internal Rate of Return (Net IRR) is the expected annualised return a fund will generate based on a series of cash flows over the duration of the fund.
It helps gauge performance based on discounted future cash flows, while accounting for fees, costs, carried interest, etc.
*Total Value to Paid - In Capital (TVPI) is the ratio of current value of remaining investments within a fund, plus the total value of all distributions to date, relative to total amount of capital paid into the fund to date.
It communicates how much a VC fund is worth on paper compared to how much money Limited Partners (LPs) have put into the fund.
*Residual Value to Paid- In Capital (RVPI) is the ratio of the current value of all remaining investments within a fund to the total contributions of Limited Partners to date.
It helps determine the fund’s remaining earning potential at any point in its lifecycle.
*Distributions to Paid - In Capital (DPI) is the ratio of cash distributions that investors have received from a venture capital or private equity fund to the total capital initially invested
It portrays the realised profits to date earned by the fund’s limited partners